

The Data Driven Roadmap
The 10 Metrics That Define My Strategy

Aloha friends,
A quick note to start: I am finalising a regular schedule for my updates, aiming for a consistent cadence of two posts per week (Thinking about Wednesdays and Sundays). Thank you for your patience as I fine-tune the structure. We will get this sorted out soon!
With that out of the way, let us move to the core of my analysis today. No talk of war or policy shifts today. What data am I actually watching?
Disclaimer: Views expressed are the author’s personal views and should not be relied upon as investment advice.
When looking at Bitcoin, there are hundreds of indicators, curves, and random inventions people use to find "magic" outcomes. Even if you sometimes find truth in them (by coincidence or whatever), I try to stick to solid foundations that have been proven right in the past and are grounded in data.
The 10 Data Points
These are the metrics I monitor to see where we stand:
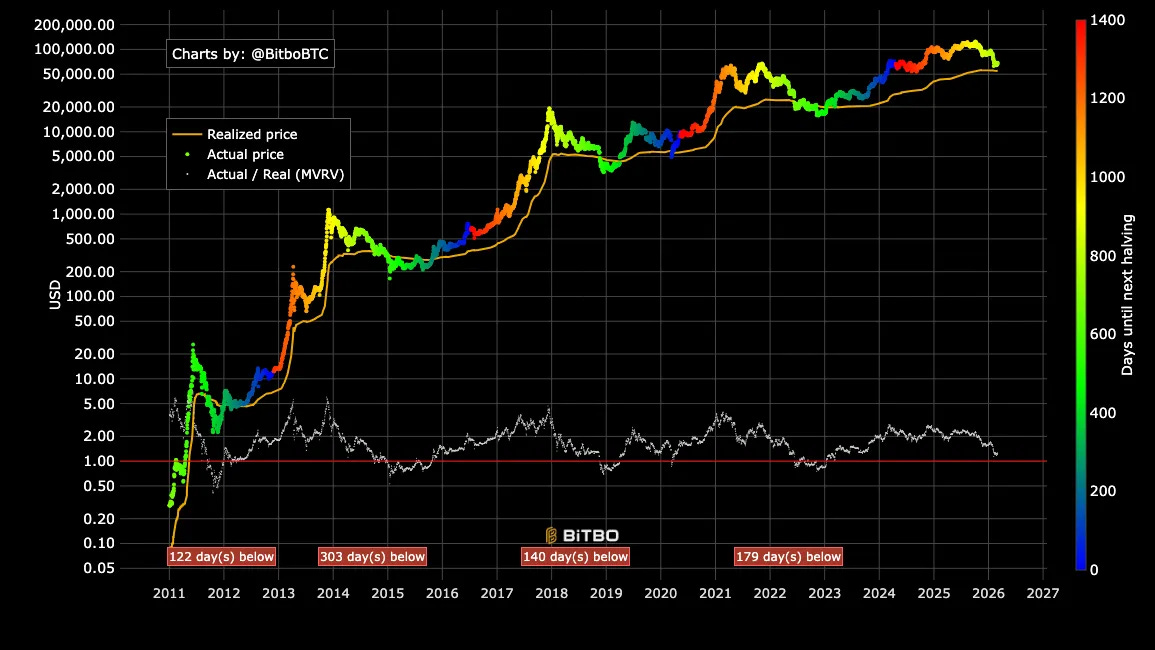
MVRV
This measures the relationship between Market Value and Realised Value.
To give some more perspective on what it means:
Market Value (MV) is Bitcoin’s total market capitalisation (current price multiplied by circulating supply). It reflects what the market currently believes Bitcoin is worth.
Realised Value (RV) calculates the value of every Bitcoin at the price it was last moved on-chain. It represents the aggregate "cost basis" of the entire supply; what holders actually paid for their coins.
The MVRV (Meaning MV divided by RV) ratio gives you a perspective on how much the current price is over (or under) the average costs price of all Bitcoins.
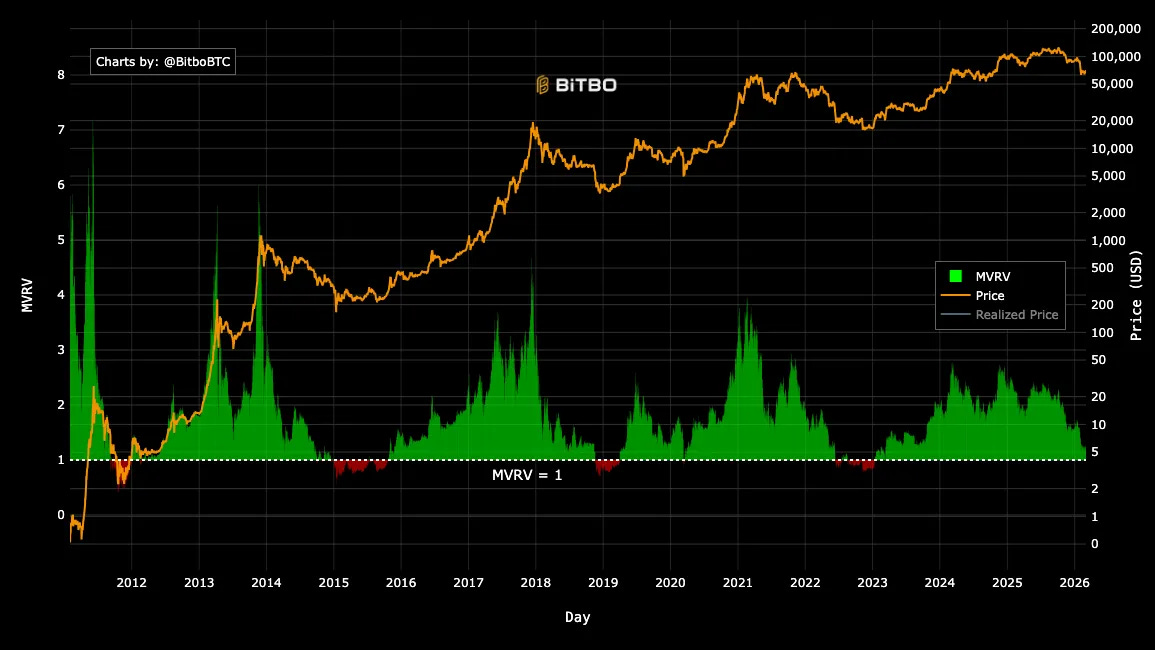
What does this mean in numbers?
MVRV = 1: The price equals the average cost basis; most holders are at break-even.
MVRV > 1: The majority are in profit. In bull markets, we see this climb significantly.
MVRV < 1: The majority are in unrealised loss. Values below 1 have historically marked bear market lows and great accumulation zones (see the red areas in the chart).
Currently we have a MVRV of 1.23 → meaning we are around “fair value”, but not in a classic capitulation territory we have seen in previous bear markets.
MVRV Z-Score
The MVRV Z-Score normalises the deviation statistically:
MVRV Z-Score = (Market Value – Realised Value) / standard deviation of Market Value
This version highlights extreme deviations more clearly (as we have seen in previous bull markets). Values above 7 have historically showed major tops, while values below 0 (or even negative) have marked undervaluation zones.
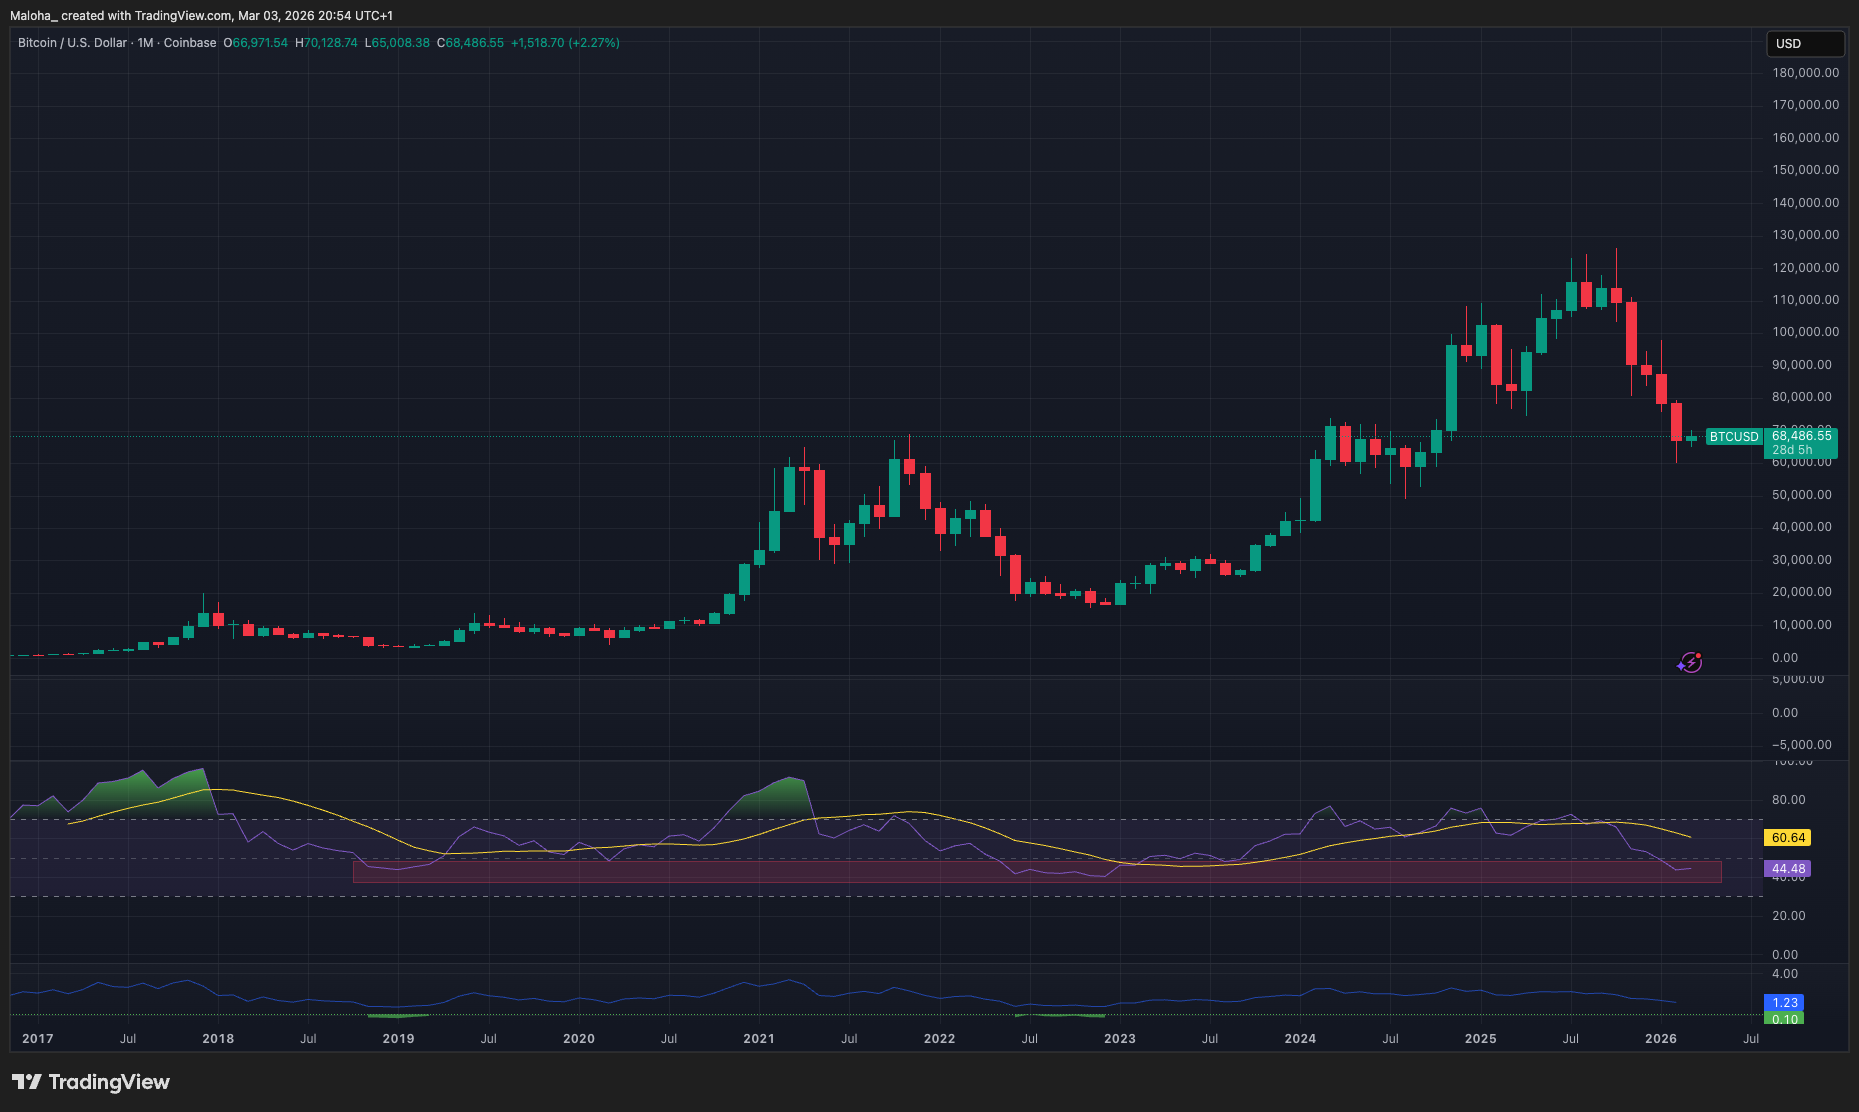
12-Month RSI
This helps me measure long-term momentum and potential trend exhaustion, filtering out short-term noise. As you see in the chart, the area between 44 and 39 are historically indicating a bottom area. Currently we sit at 44.44.
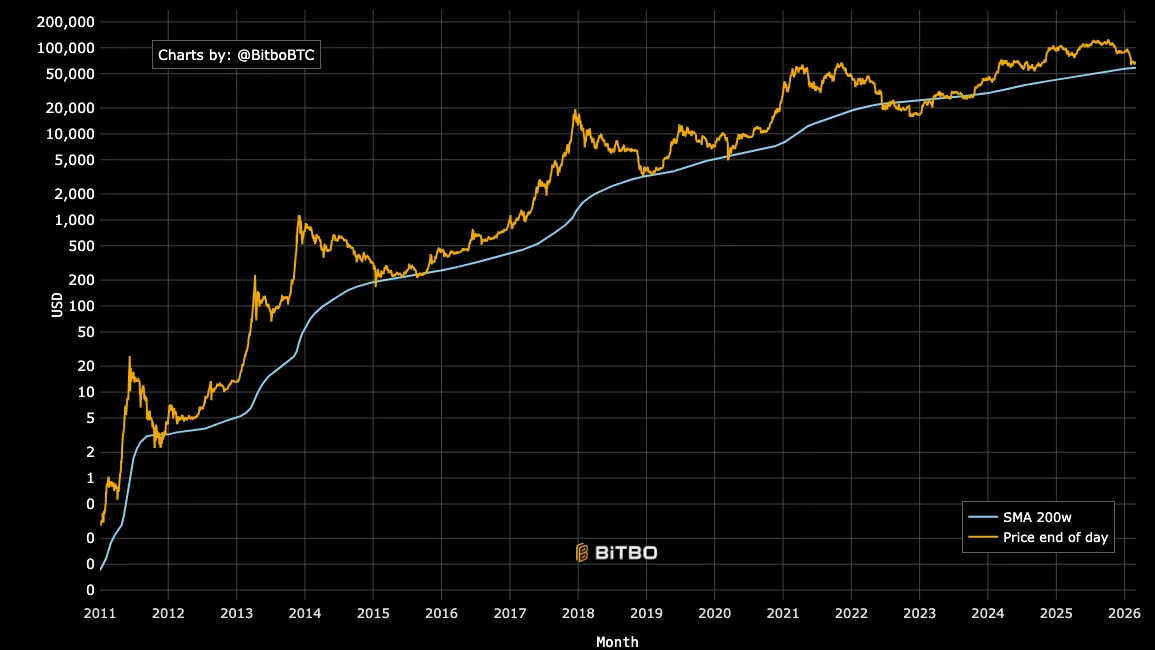
BTC vs. 200-Week Moving Average (WMA)
A classic technical benchmark that has acted as a macro support layer in previous cycles. Currently it sits around $58,400.
Supply held by Long-Term Holders (LTH)
Long-Term Holders (LTH) are defined as addresses holding Bitcoin for 155 days or more. This cohort is often viewed as “smart money”. Investors with high conviction who tend to accumulate during weakness and distribute (sell) into strength.
Rising LTH supply signals accumulation by strong hands, reducing available circulating supply and often supporting price floors. Declining LTH supply indicates distribution, which can create overhead pressure during bull runs.
LTH supply stands at approximately 72–73% of the circulating supply. Recent trends show net accumulation in the past month, suggesting conviction holders are buying weakness.
Supply held by STH
Short-Term Holders (STH) hold Bitcoin for less than 155 days. This group is frequently labeled “dumb money” ; typically retail. More price-sensitive, FOMO buying at highs and panic selling at lows.
Rising STH supply often coincides with euphoric tops, while sharp declines can signal capitulation and bottoms (weak hands shaking out).
STH supply is around 12–13% of circulating supply. This is relatively low and recent price weakness has seen limited panic from this cohort.
LTH Supply in Loss
When high-conviction holders begin to realize losses, it marks the final phase of a bear market. Currently, LTH supply in loss is negligible (<0.1%), suggesting that while we are in a correction, we haven’t reached full terminal capitulation.
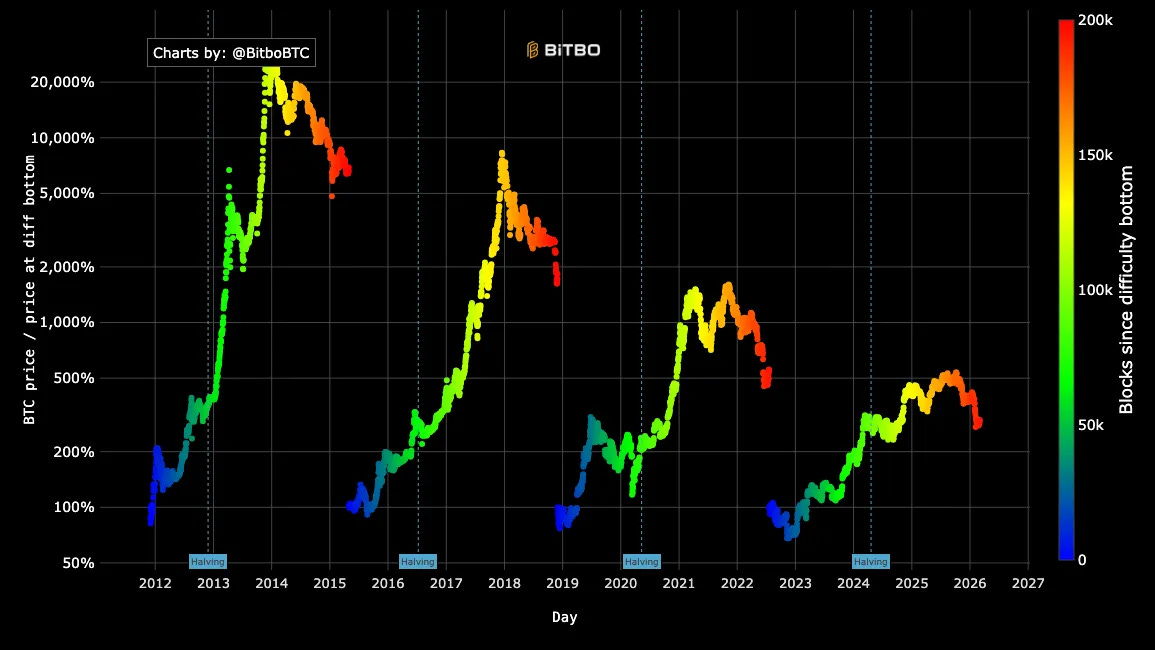
Price-to-Cost-of-Production
When the market price drops below mining costs, forced miner selling often creates a floor. With Average Mining Costs at $89,800 and BTC at $68,400, our current ratio is 0.76.
BTC Realised Price Band
The average price paid by the market (currently ~$54,500). Historically, price tends to dip below this before finding a structural bottom.
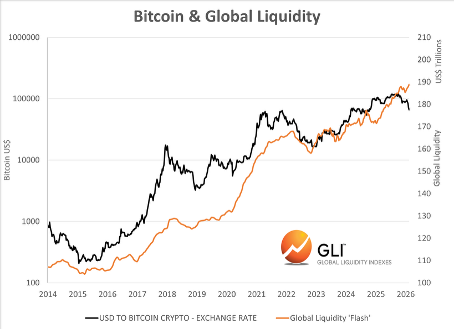
Global Money Supply (M2)
As Bitcoin acts as a liquidity sponge, the growth of global M2 is the primary engine for “risk-on” environments. I have discussed how BTC is reacting to M2 (leading & lagging) in a previous report. As we currently have war going on, things remain being to observed and how this will play out.
Now, out of these data points, I have created a table to compare the current data against previous cycle lows. If you want to see exactly how this looks, subscribe for free so you do not miss it!
Final Thoughts
You may ask which indicators are currently flashing green. My answer remains: we are still in a "wait and watch" phase. My strategy is not to guess the exact day of the bottom, but to wait until the confluence of these 10 data points aligns with a high-probability setup. However, some indicators show me, that we should not be too far away from a bottoming area (this is of course to be seen relatively to the ATH).
Portfolio Management
No major updates. As mentioned, if you have no allocation, current prices are at fair value, and I prefer to have "some eggs in the basket" rather than being completely out.
NOTE: This was written before todays run up. As mentioned in my previous post, this is an expected rally to approx. a range between $74k-80k in my perspective.
That’s it for today - I hope I could deliver some valuable insights.
Maloha
Stay Humble. Stay Curious. Enjoy the Journey.
Disclaimer: Views expressed are the author’s personal views and should not be relied upon as investment advice.