

The ETF Honeymoon is Officially Over
Why Wall Street is Pausing (and Why it is Not an Exit)

Aloha friends,
most of us will probably only know the “Gold Rush” from what we have been told at history classes in school. This happened around the 1850s. That is the feeling many had in 2025, when the crypto spot ETFs were smashing almost daily records and everyone felt there is only one direction: “up right”.
Fast forwards to February 2026, it feels like waking up from a very long night with to many drinks. Since Oktober last year, we have seen consistent weekly net outflows from major crypto ETFs. With this, the question may arise: Was institutional adoption just the next hype? Is “Smart Money” leaving the dance floor?
Today, I am looking under the hood of the current market dynamics and provide some more clarity in that picture.
Disclaimer: Views expressed are the author’s personal views and should not be relied upon as investment advice.
ETF-Hangover: What is Really Happening?
First, let us look at the hard numbers:
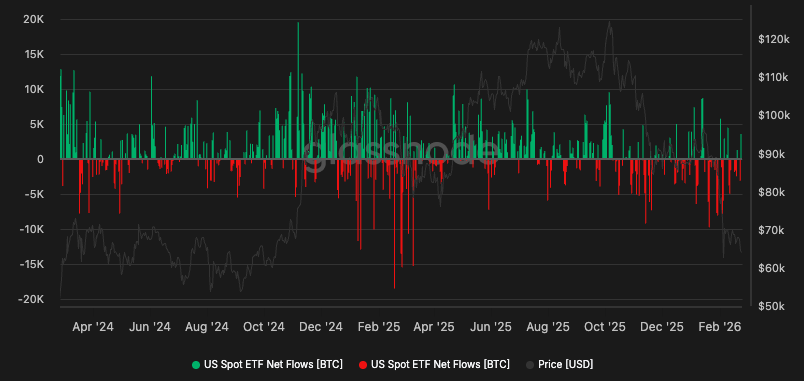
YTD 2026 Net Outflows: $4.5 billion
Since October 2025 Peak: Cumulative $10 billion outflows
Cumulative Net Inflows Since Launch: $54.4 billion
Total ETF AUM: $91 billion (ca. 6% of BTC’s market cap)
Yes, the last months and especially the last 5 weeks have been challenging. However, it is easy to interpret the red bars on an ETF flow chart as a total exit. Giving it a more nuanced picture, we can see:
Institutions are Rebalancing: Portfolio managers are bound by strict mandates. After the massive run-up in 2025, Bitcoin’s weighting in many diversified funds simply became “too large.” The selling we’ve seen since October isn’t necessarily a vote of no confidence; it is simple math. They are trimming gains to maintain their target allocations.
Risk-Off Mode: Wall Street is reducing speculative bets. Uncertainty around FED rates, Trump policies & tariffs and Gold pulls liquidity. BTC is once again treated purely as a “risk asset,” not digital gold.
There are no Buyers: The ETF narrative (“institutions finally here”) has cooled. No new billions from pensions/sovereigns on the horizon. What we have instead is rebalancing and no retail around the corner (especially after the October flash-crash.
Technical & Psychological Feedback Loop: Coming from the previous point, this leads to: Outflows → less buy pressure → price drops → more outflows. Classic negative spiral.
The ETF outflows are real and painful, but they haven’t destroyed the $54.4B structural inflow foundation built since 2024. This is a stress test for the “Bitcoin as institutional asset” thesis. Honeymoon might be over, but we are just back to reality and need to organised ourselves after the shiny phase.
As mentioned in my previous report, US as main capital driver and Eurozone are going into risk-off mode. We have a potential War in Iran, there is still a war in Ukraine, we have the trade conflicts and many political “issues” growing in multiple countries. Additionally, we have the so seen holy grail, called AI, which may disrupt many things we have build our society and economy on. All this at once. there is a big portion of uncertainty in the markets, which is reflecting risk-on assets, and crypto is still seen as a risk-on asset class.
What I’m Watching Now

Looking at the graph, we can see that Bitcoin broke the main on-chain pricing models while heading to the Realised Price which currently ranges around $54,600. Considering past bear markets we tend to cross this line and bottom somewhere not far below it.
Additionally, the MVRV (Market Value to Realised Value) is something I closely observe in my analysis before making moves. Historically, we are in a very low phase already, however, the deep bear market at peak bottom, tend to give us a MVRV below 1.
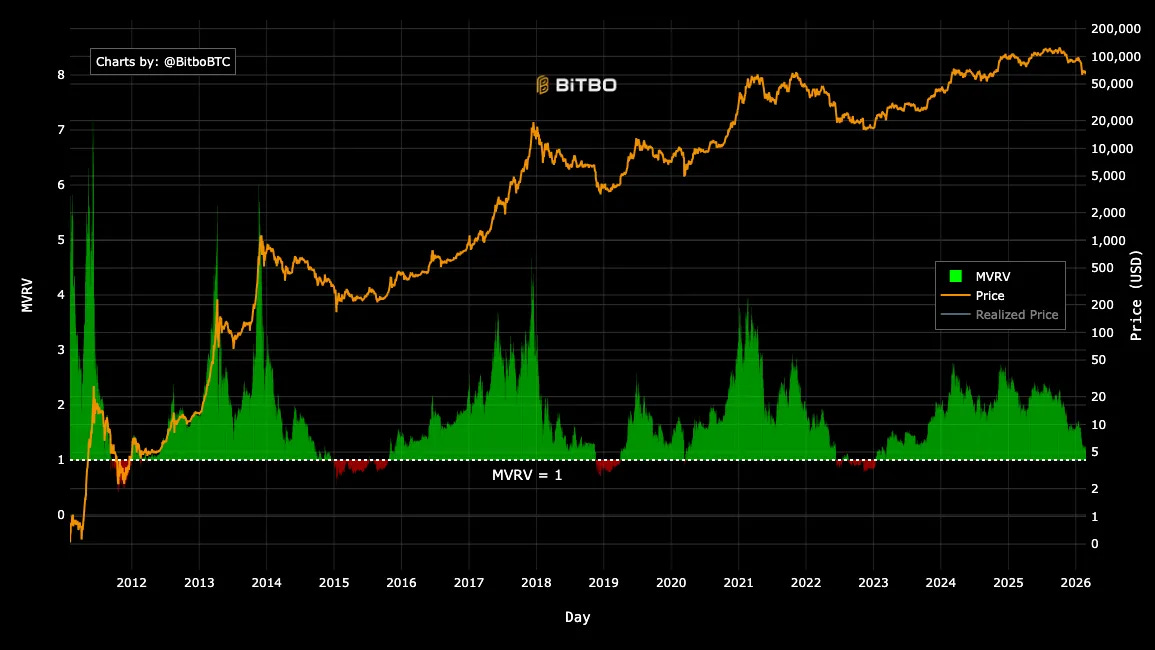
It looks like we can see sellers getting less. However, there is still no big demand pressure incoming and the market seems to be week. Around the bottom area, there is normally a big shift in demand happening. This mirrors with my thesis above, that the price will probably drop below the Realised Price, meaning below the $54,600 mark before we are getting into the bottom area.
So I need to repeat myself like a clock: it is still the time to be patient.
That’s it for today - I hope I could deliver some valuable insights.
Maloha
Stay Humble. Stay Curious. Enjoy the Journey.
Disclaimer: Views expressed are the author’s personal views and should not be relied upon as investment advice.