

The Valuation Trap
From AI-Rebranding Hype to Record Buffett Levels: Why the Market is Playing with Fire

Aloha friends,
Following my last report, we have seen a strong surge of 7.7% in the NASDAQ and up to 5.2% in the S&P 500, leading both to new All-Time Highs. Bitcoin topped out at a 10.8% gain in the same period. I previously mentioned that new highs for the stock markets were possible if we saw positive announcements regarding the Iran conflict, and that is exactly what played out.
Today, I don’t want to get much into geopolitics. Instead, I want to provide a deeper dive into the surge of the markets to see if the current universal bullishness is actually justified.
Disclaimer: Views expressed are the author’s personal views and should not be relied upon as investment advice.
Is Everything Fine?
If you look around, there is a sense of massive relief. The common narrative is that we are now free to ride into the sunset of higher highs. Before you buy into that, consider who is telling the story:
People calling for higher are often heavily invested and talking into their own pockets. This includes Larry Fink (BlackRock) and other institutions that profit from your trading volume
AI companies & Influencers are screaming that AI will take over everything and displace all jobs in 1–3 years
The three-week blockage of the Strait of Hormuz is being treated as if it never happened, with the assumption that the economy will simply boom from here
Michael Saylor has created a system offering investors an 11% yield on Bitcoin, paid out monthly (or even bi-weekly soon)
So why am I still talking bearish when the bulls have seemingly taken over?
Let’s look at the data.
Markets: A Thin Surface
We saw new ATHs in major US ETFs last week, and I must admit: anyone who bought that dip did a great deal. But if you look deeper, the rally is surprisingly narrow. Only 4% of S&P 500 companies actually reached an ATH. Many sectors, particularly SaaS, are still far off their highs.
So, who is carrying the market?
Financial institutions: Companies like BNY Mellon (BK), Interactive Brokers (IBKR), and Morgan Stanley (MS) are profiting from record trading volumes
Semi-Tech: Advanced Micro Devices (AMD) and Western Digital (WDC) are surging because they provide the hardware for AI
The real question: where is the measurable impact of AI for the average person? Ask your neighbors how they are actually making or saving money with AI today. It is easy to fall into the “AI changes everything” trap on social media. While it might be true eventually, for the time being, if it doesn't drive promised revenue, a trillion-dollar chatbot is just an expensive toy. Companies like Anthropic & OpenAI still have to prove their $800b+ value.
NewBird: Does History Rhyme?
AI seems to further push the market. But wasn’t there and interesting story this week? Yes. A shoe company called Allbirds hit the news. Let me give you a small breakdown:
Allbirds went public in 2021 at a $4b valuation and proceeded to drop 99%. They closed their US stores and sold the brand for roughly $40m
They renamed themselves to NewBird AI
The stock rallied 940% in a single day on 800x above normal volume
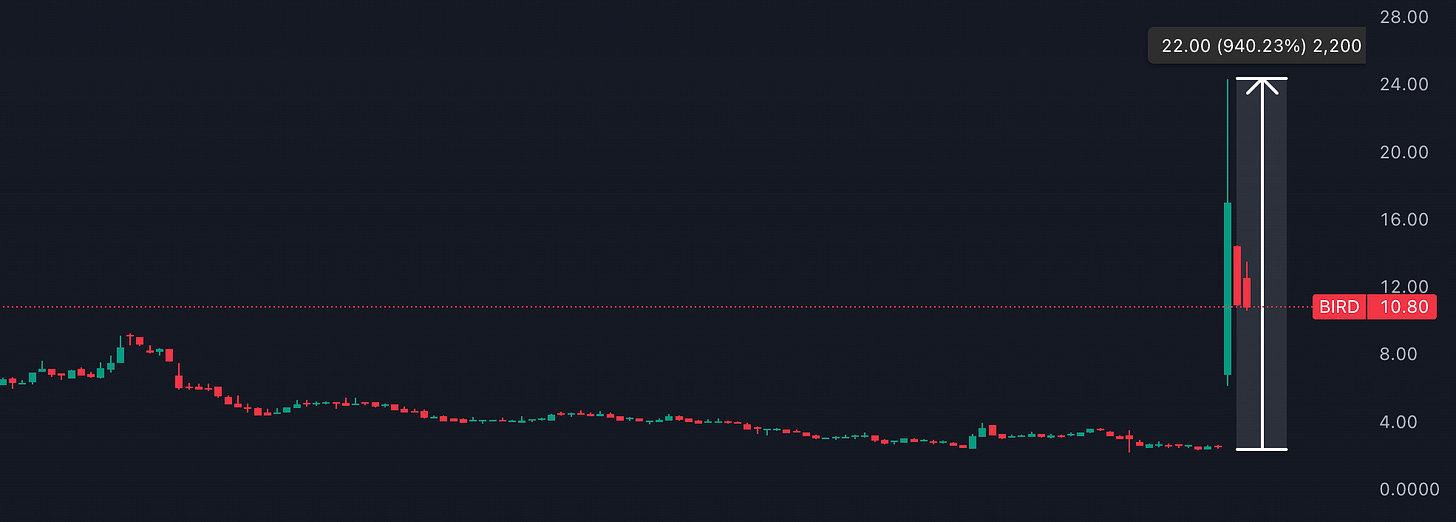
Source: TradingView

Seeing these movements in the stock market for a company basically renames itself with AI in the name, reminds me of two specific ghosts of the past:
Dotcom (1999): MIS International rebranded to Cozmos.com and went up 10x.
Crypto Hype (2017): Long Island Iced Tea rebranded to Long Blockchain Corp and jumped 200%.
We all know what happened next. History doesn't always repeat, but it certainly rhymes.
But let us go deeper in this. What is the underlying data telling us?
The Shiller PE Ratio
When investing into stocks, people often look at the price to earnings ratio (PE). If this value is to high, investors tend to come to the conclusion that the stock is probably overvalued.
Now, if we look at the PE ratio not just for one specific stock, but for the full scope of the S&P500, the Shiller PE ratio provides us a good guidance. It shows the PE ratio based on average inflation-adjusted earning from the previous 10 years.
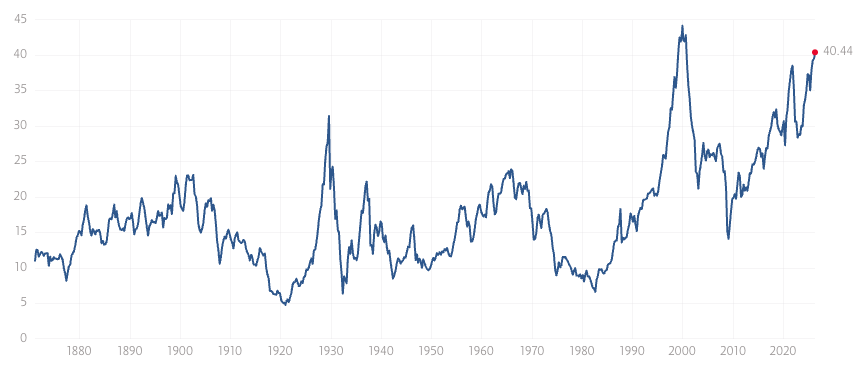
We are currently sitting at the highest valuation in 26 years. The last time we were here? The peak of the Dotcom bubble.
Ok, now you may say: Yes, however we now have a different fiscal policy and PE is not such a good indicator, especially for tech stocks. So let us look at another data point.
The Buffet Indicator
The Buffett Indicator is a simple valuation metric for the overall stock market. It compares the total value of the stock market to the size of the real economy (Buffett Indicator = (Total Market Capitalization / GDP) × 100). The values you get typically mean:
Around 70–90%: The market is considered undervalued
Around 95–110%: Roughly fair valued
Above 120–150%: Overvalued
Above 200%: Extremely overvalued. Warren Buffett once described levels approaching this as “playing with fire”
In essence, the indicator shows how expensive the entire stock market is relative to the actual goods and services the economy produces. If market values rise much faster than the underlying economy, it signals potential overheating or a bubble-like condition.
So where are we today? Currently at record-high levels of 232.6%!

Looking at the chart, it was a good indicator for the dotcom bubble as well as for the correction in 2022. Now we are even higher. Does this mean we will go South instantly? Well, it flashes at least a cautionary signal, but it does not predict the exact timing or guarantee an immediate crash.
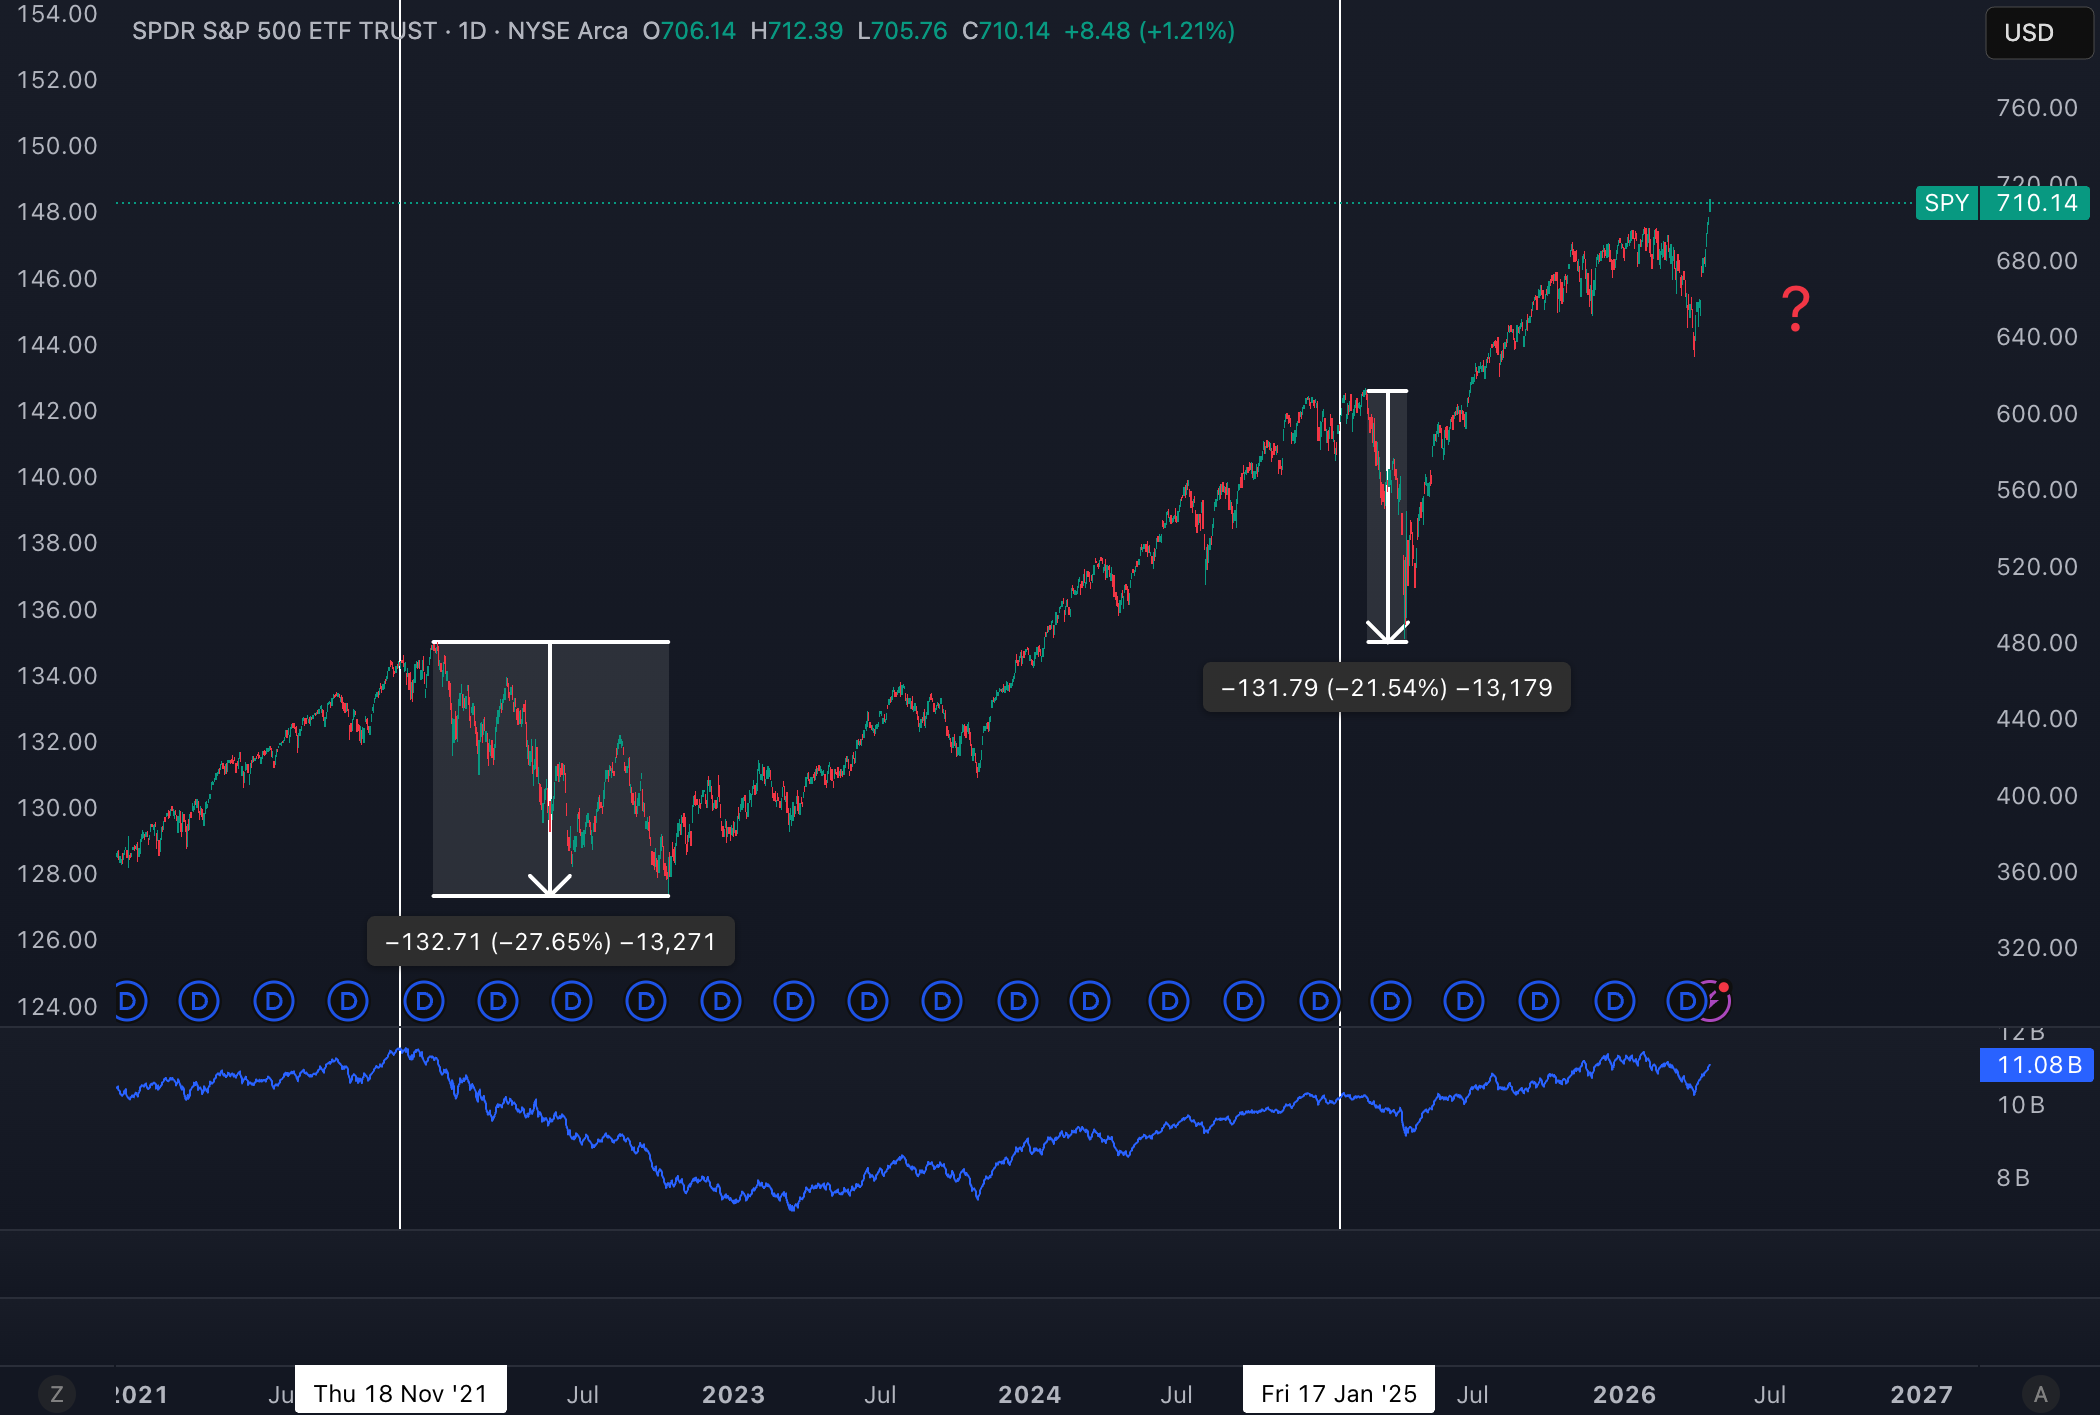
Bearish Divergence
Another metric I am looking at is the On-Balance Volume (OBV) compared to the S&P 500.
In simple words: OBV = A volume-based score that shows whether money is flowing into or out of a stock over time.
If the OBV is rising, we have more volume which suggests buying pressure. A falling OBV means more volume is coming in on down days, which suggests strong selling pressure.
Typically, a rising market needs rising volume. However, the S&P 500 is making ATHs while the OBV is not. This divergence suggests the rally is weak and isn't being confirmed by actual buying pressure. We saw this in 2022 and early 2025, followed by 27% and 21% corrections, respectively.
A divergence is another warning signal I see. However, this does not predict us a specific timing but it shows us that the probability of a correction is rising.
As you have seen, there a various datapoints hinting that the stock market might not run forever and the warning signals are clear, that we are in a very much heated situation.
But what does this mean for Bitcoin?
Bitcoin
While ETFs are at ATHs, Bitcoin is still down roughly 40% from its own peak. We have seen a 30.5% relief rally since the February lows, which has brought the bulls out of hiding.
Yet, these are probably people who bought the “dip” down from ATH into the mid 80s. A massive amount of volume was traded between $85k–$87k. Many people who bought there are maybe just waiting for a bounce to break even and exit.
For the first time in three years, the 180-day Realized Price change has turned negative. This means older coins are being sold at a loss.
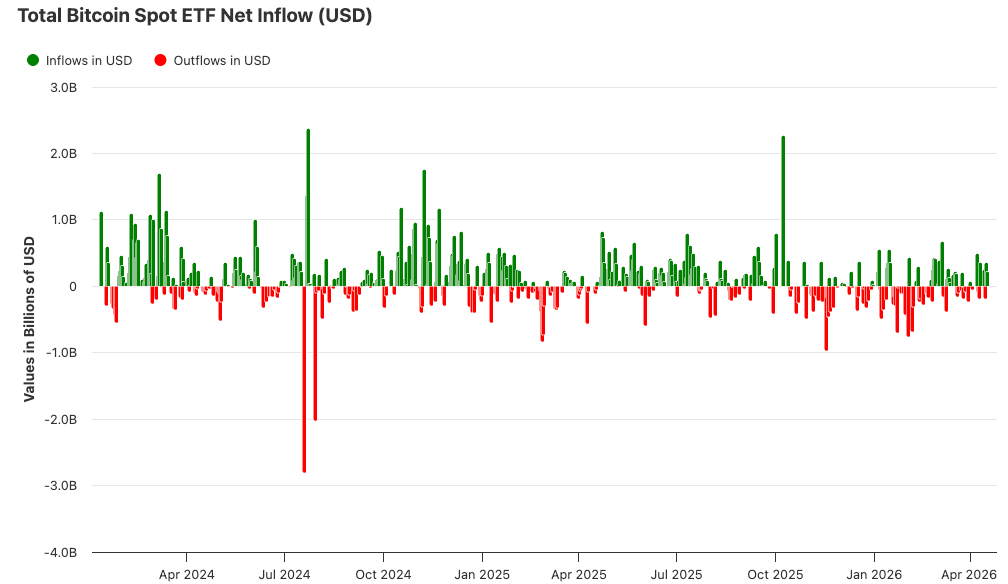
If you look at the ETF flows; yes, we have seen some green days (probably also driven by Michael Saylor), but compared to previous timeframes, the volume is still low.
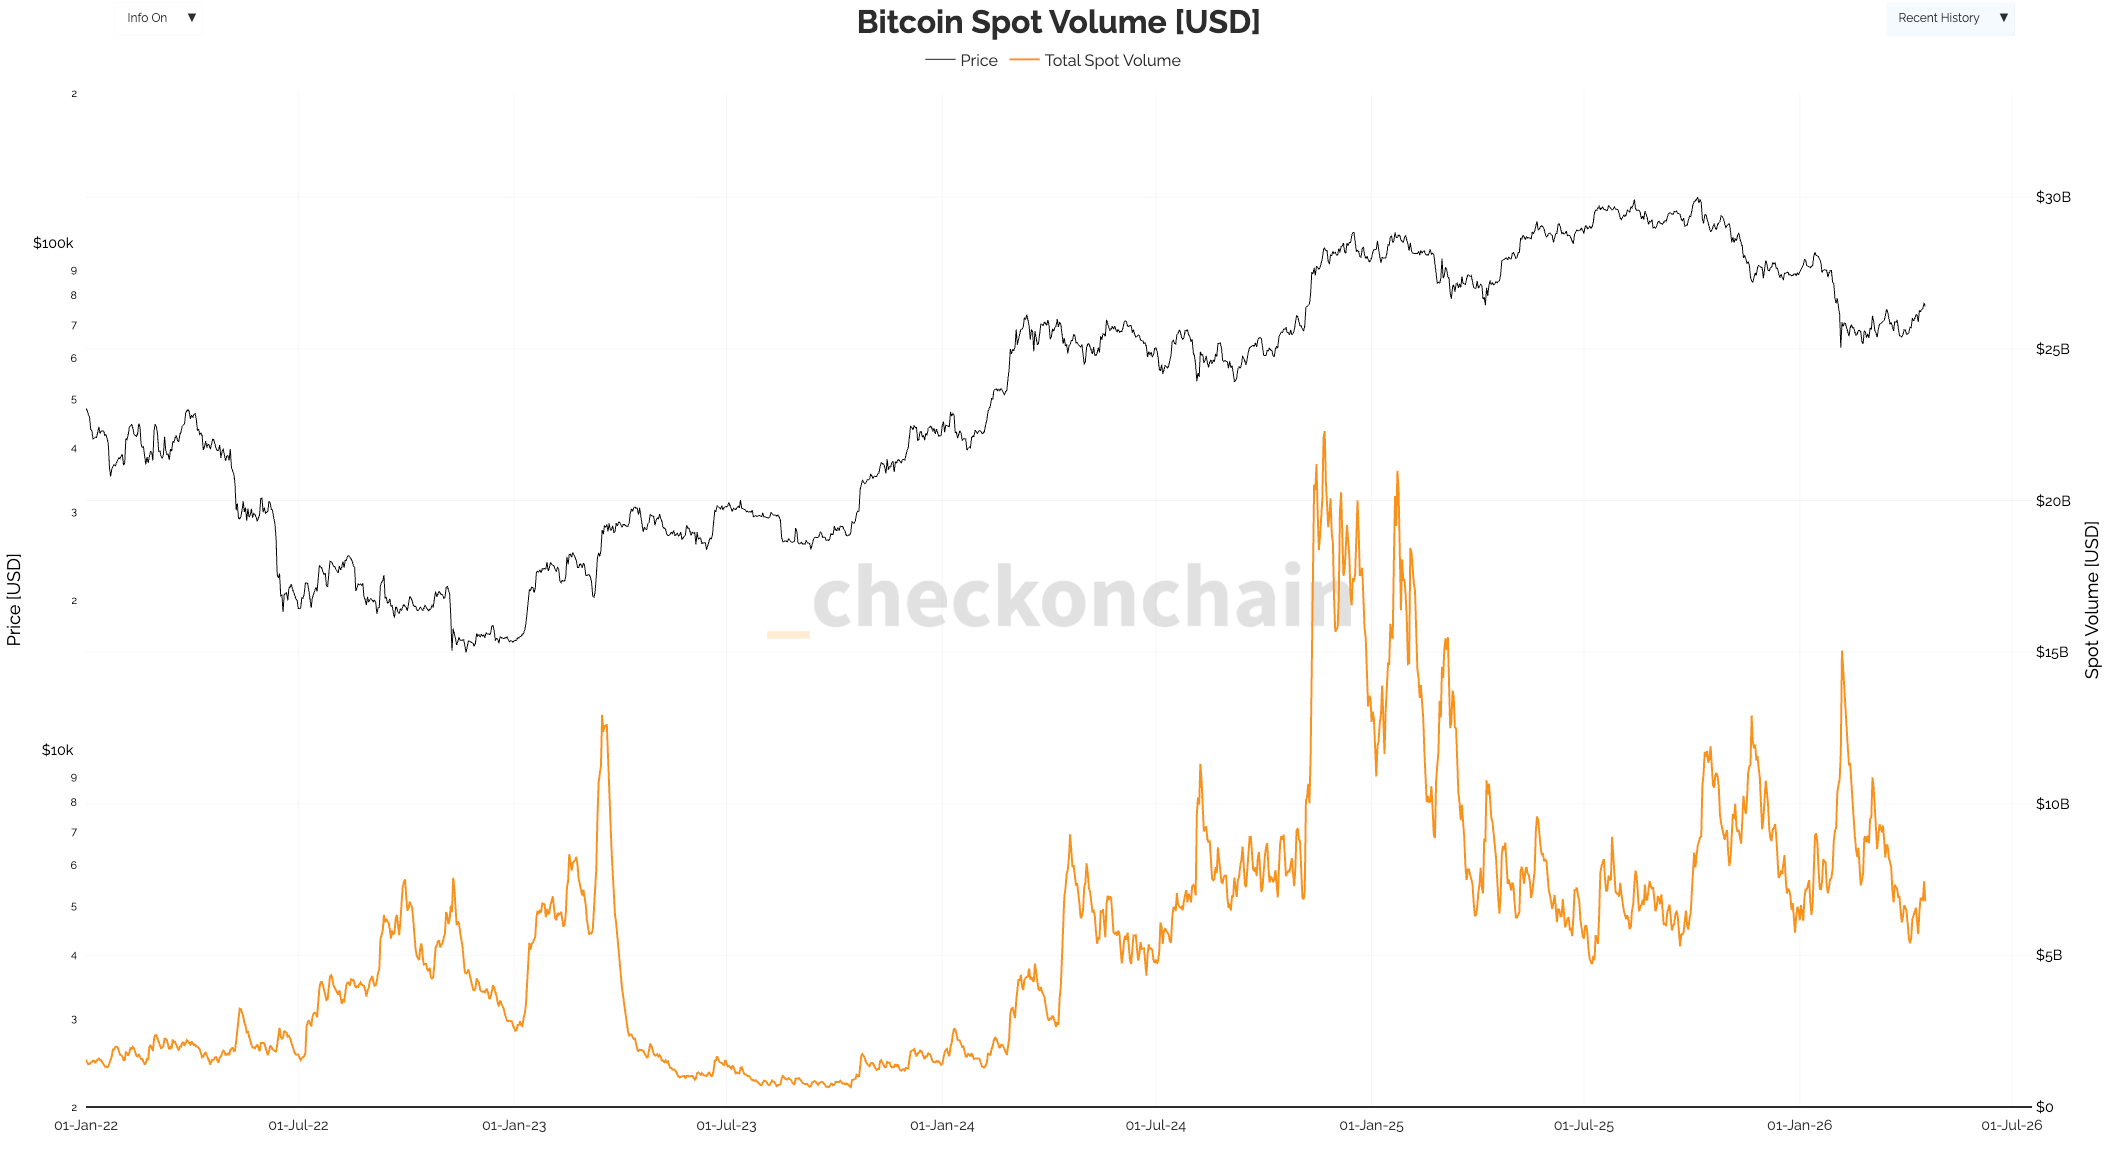
Additionally, Bitcoin spot volume shows that we are far from highs and trending more in the lower end of volume (but still higher as in last bear market).
Interesting to see it that with the current move upwards, the funding rates have gone down massively. Typically, funding is most of the time positive, but now we are since some days in deep red territory. Thus, way more people are shorting the market at this stage and do not believe in the positive momentum.
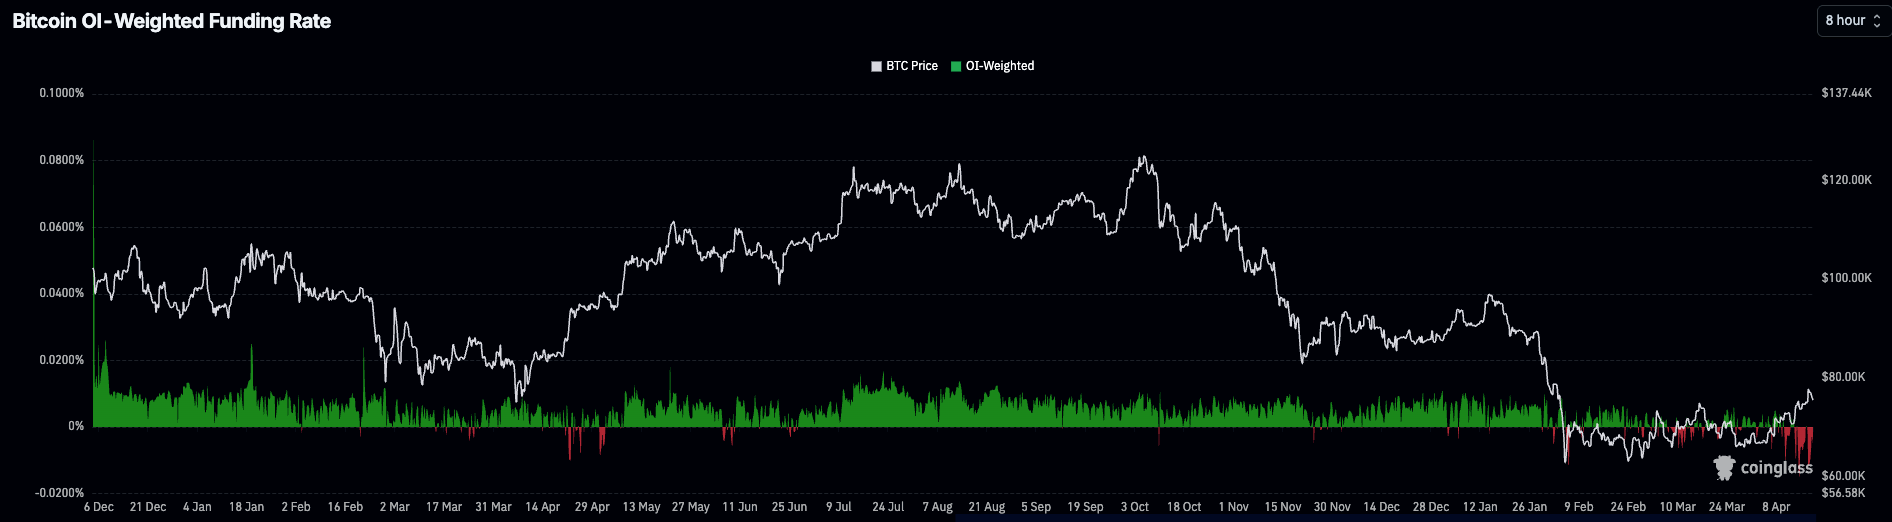
This could now either lead to a short term squeeze against the short sellers and we see another push upwards to the earlier mentioned $85-87k range, or the bears win and we go lower. However, I do not want to focus too much on short term movements here.
All over all, looking at these data, the time we are in the cycle, the upcoming summer phase, the overheated conditions on the stock market, I find it hard to believe, that we are just going up from here. We are technically still in a bear for Bitcoin.
Final Thoughts
My main thesis stays intact. This is not the time to be Risk-On. Between extreme valuations, AI hype, and a disrupted global economy, the honeymoon in the markets is likely nearing its end.
The markets can stay irrational longer than you can stay liquid, but the signs are everywhere. Can we stay higher longer? Sure we can. It wouldn't be surprising if the highly anticipated IPOs of the earlier mentioned AI companies eventually mark the structural top of this market cycle.
Portfolio Management
I scaled more into my shorts during the run-up this week and took profits from my hedge trade. Beyond that, I am practicing patience. No new purchases were made. And remember: You should never chase a market that is “playing with fire”.
That’s it for today - I hope I could deliver some valuable insights.
Maloha
Stay Humble. Stay Curious. Enjoy the Journey.
Disclaimer: Views expressed are the author’s personal views and should not be relied upon as investment advice.