

The Wall of Breakeven
Reclaiming the Mean: Between Structural Recovery and Behavioral Resistance

Aloha friends,
Another green week is in the books. The stock market continues to notch new highs, and Bitcoin is maintaining its positive momentum. While the conflict in the Middle East is far from over, the markets seem to have priced in a resolution for now.
Despite the recent pump, my core thesis hasn’t shifted. I look at Berkshire Hathaway sitting on a record $382 billion in cash—a move they’ve made twice before: right before the Dotcom bubble burst and just before the 2008 financial crisis. You have to ask yourself: are they right again, or is it truly different this time? While I see the crowd celebrating, I prefer to look under the hood.
Disclaimer: Views expressed are the author’s personal views and should not be relied upon as investment advice.
Reclaiming the True Market Mean
During the run up this week, we have seen the area around $78.1k as a strong resistance zone (and this is where Bitcoin is sitting at the time of writing). At this level sits the True Market Mean where I expect distribution pressure from underwater investors to cap this relief rally.
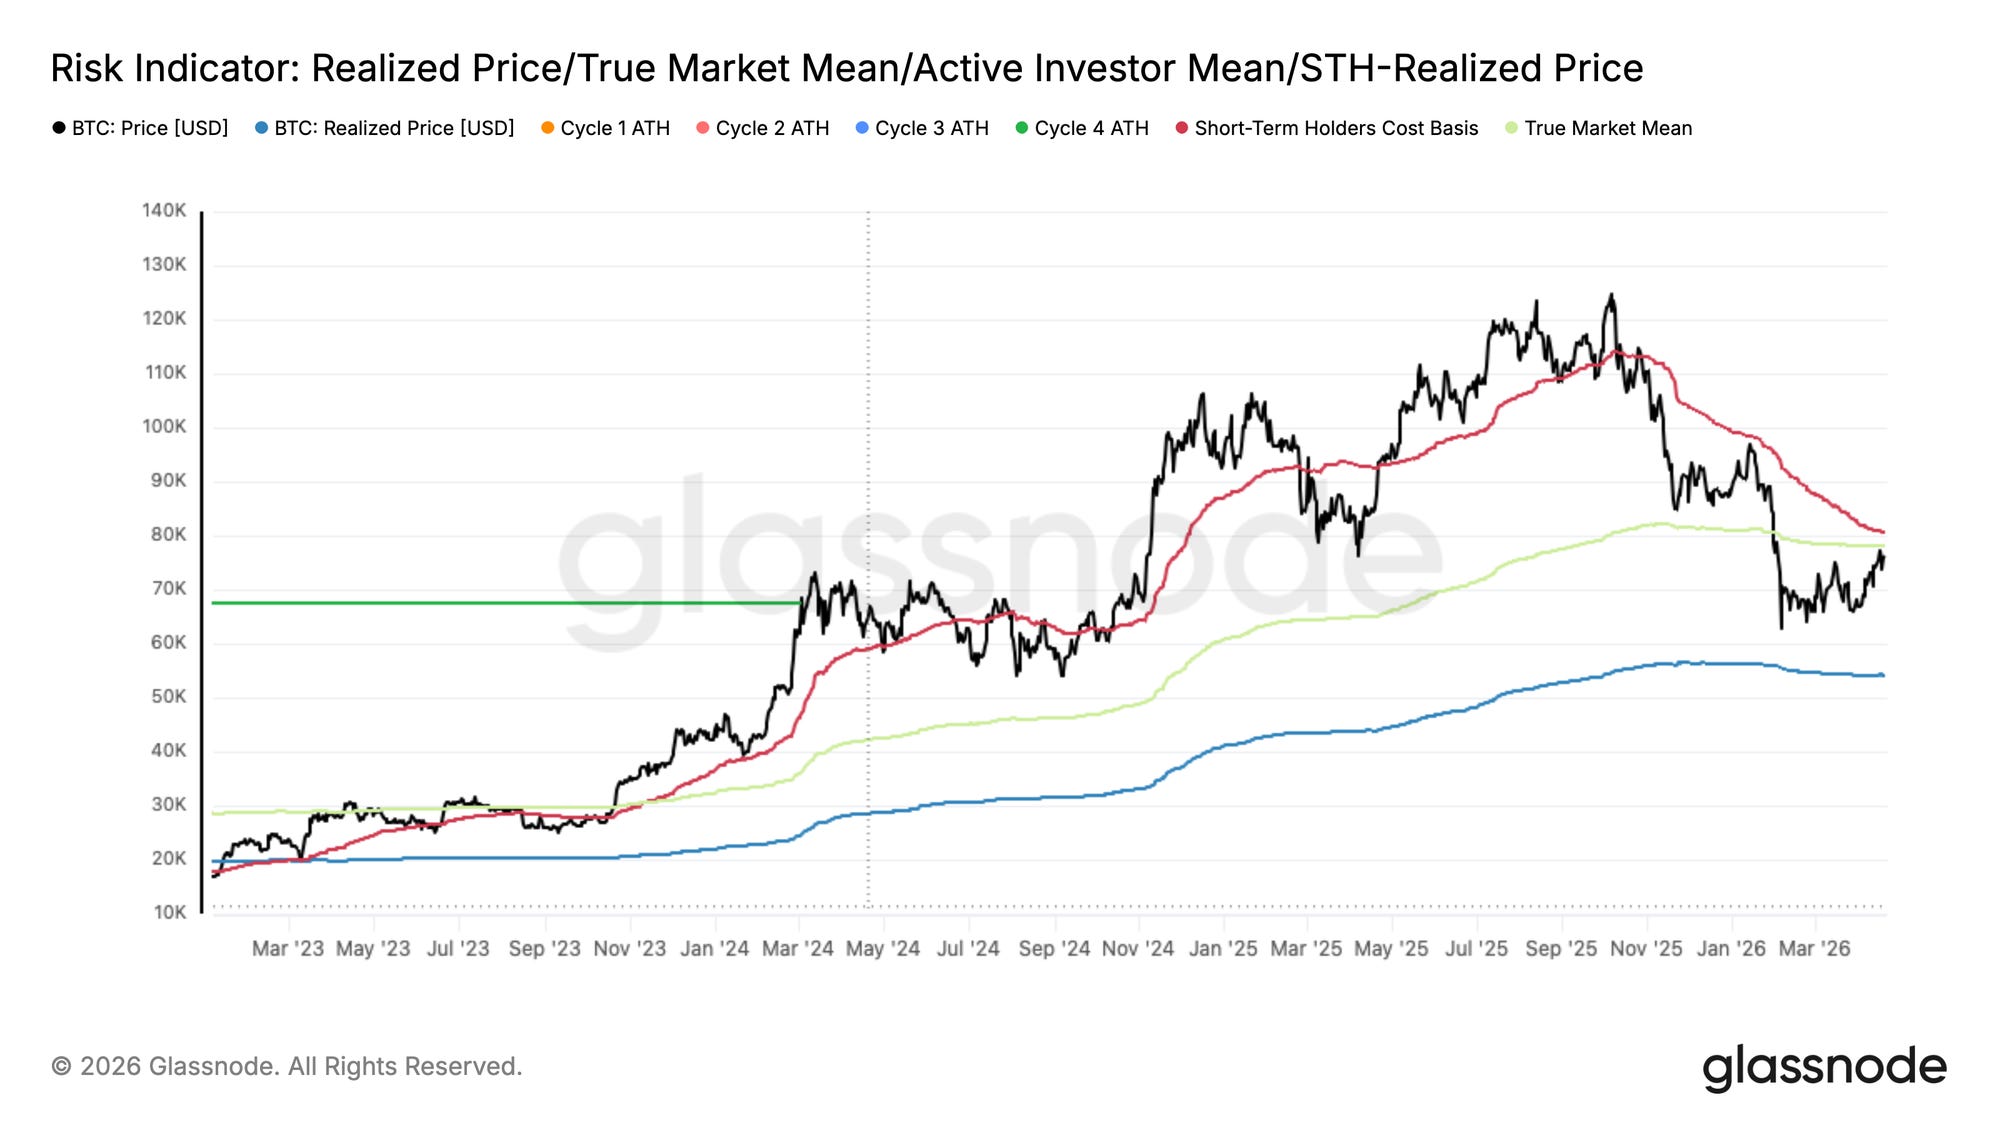
The True Market Mean tracks the cost basis of actively transacted supply. Reclaiming this model historically marks a transition from deep bear market conditions toward a more constructive regime. A Breakout of this level represents a significant mean reversion within the ongoing bear market, with the next logical target being the Short-Term Holder (STH) Cost Basis at $80.5k.
However, caution is still warranted. We are seeing mounting sell pressure from investors who accumulated in the $60k–$70k range. As this cohort approaches breakeven, the behavioral incentive to “just get out” begins to weigh on momentum.
The Next Wall: The Short-Term Holder Cost Basis
Having cleared the first hurdle, the market now faces a more formidable test. The Short-Term Holder Cost Basis at $80.1k represents the average acquisition price of investors who purchased within the last 155 days. This group is historically the most price-sensitive in the market.
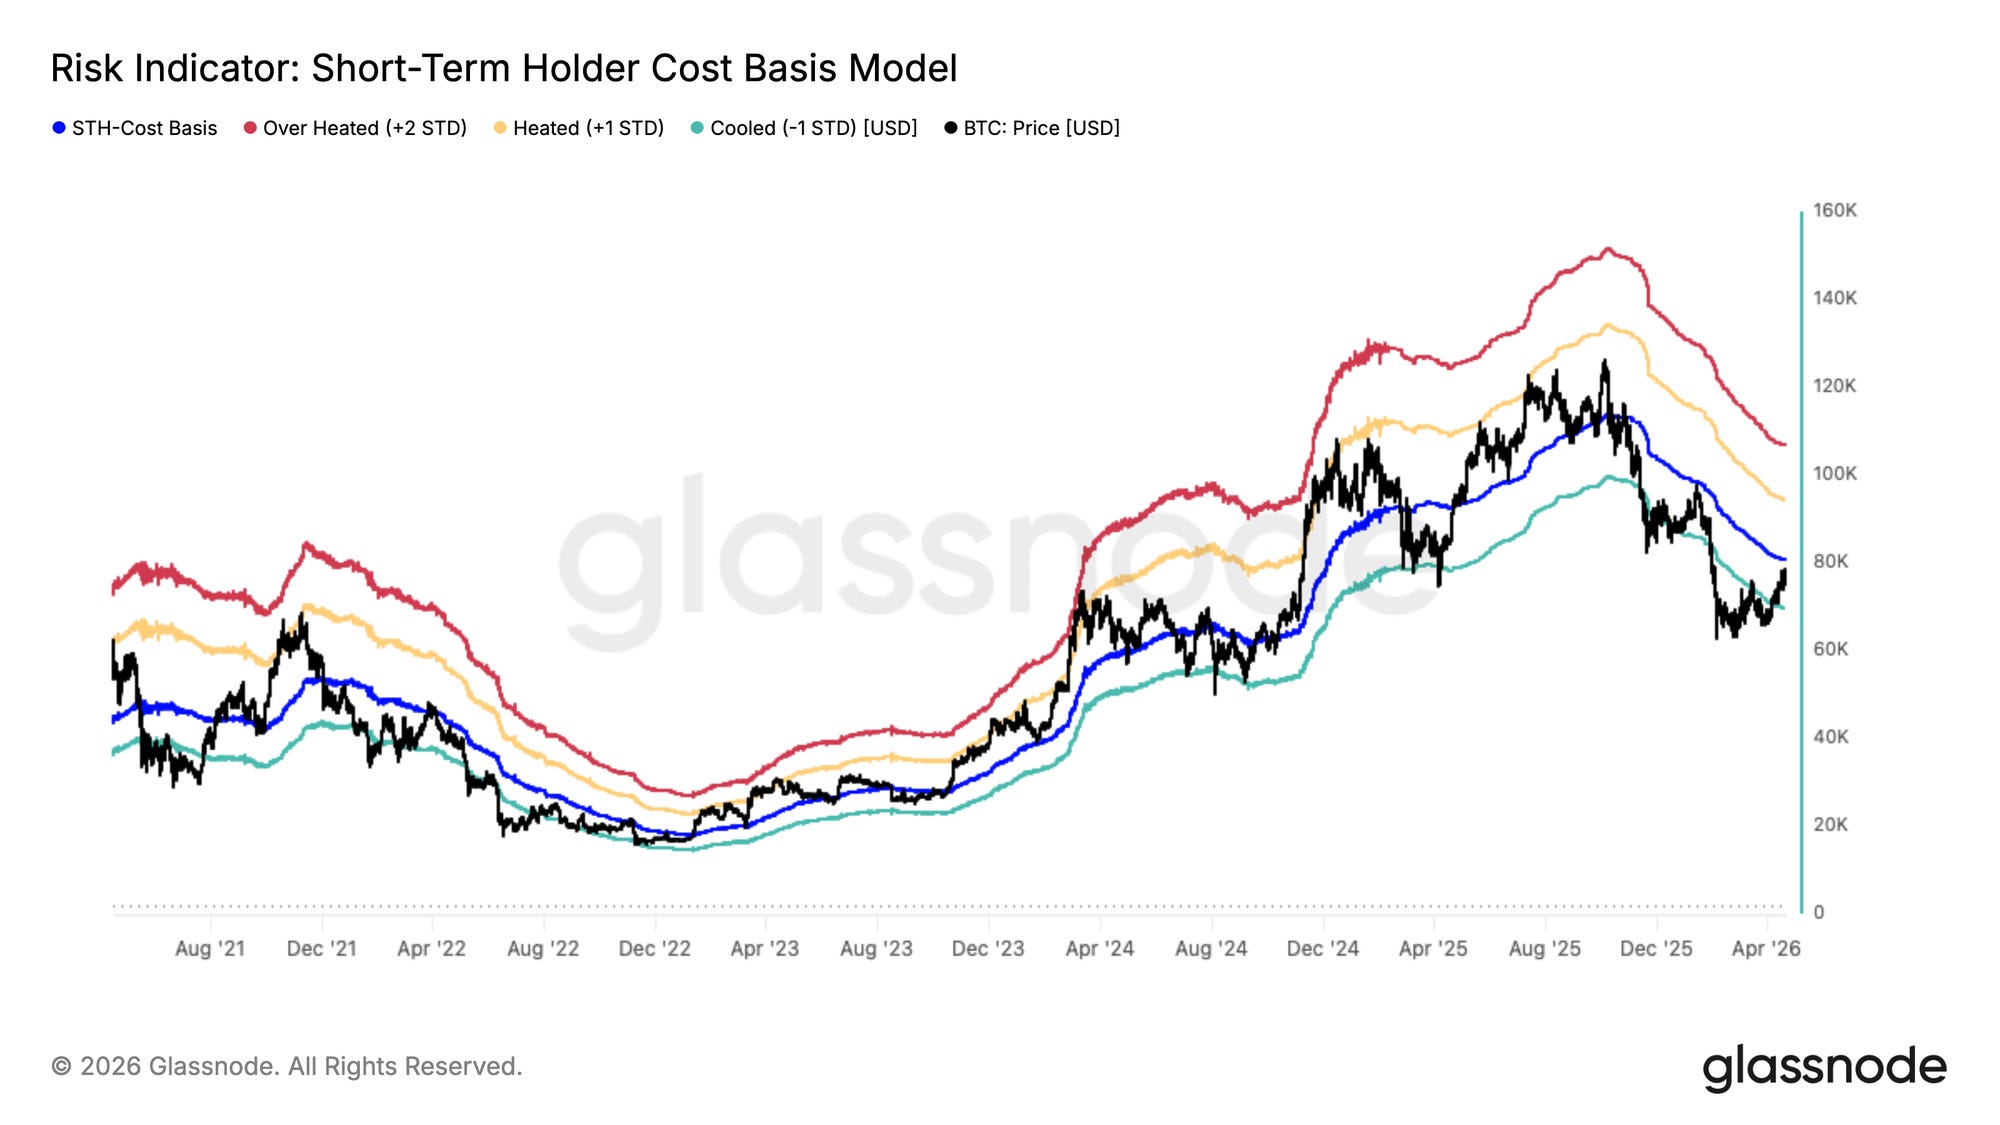
As price approaches their breakeven level, the supply hit is inevitable. In past bear markets, rallies toward the STH Cost Basis rarely break through on the first try. Instead, price tends to contract back toward the -1 standard deviation lower band (currently near $69.9k) to reset before attempting another breakout. This suggests that while $70k is developing into a mid-term support floor, the $78k–$80.1k zone remains a heavy ceiling.
Where Bear Rallies Exhaust
To understand why this $80k level is so heavy, we look at the Percent of Short-Term Holder Supply in Profit.
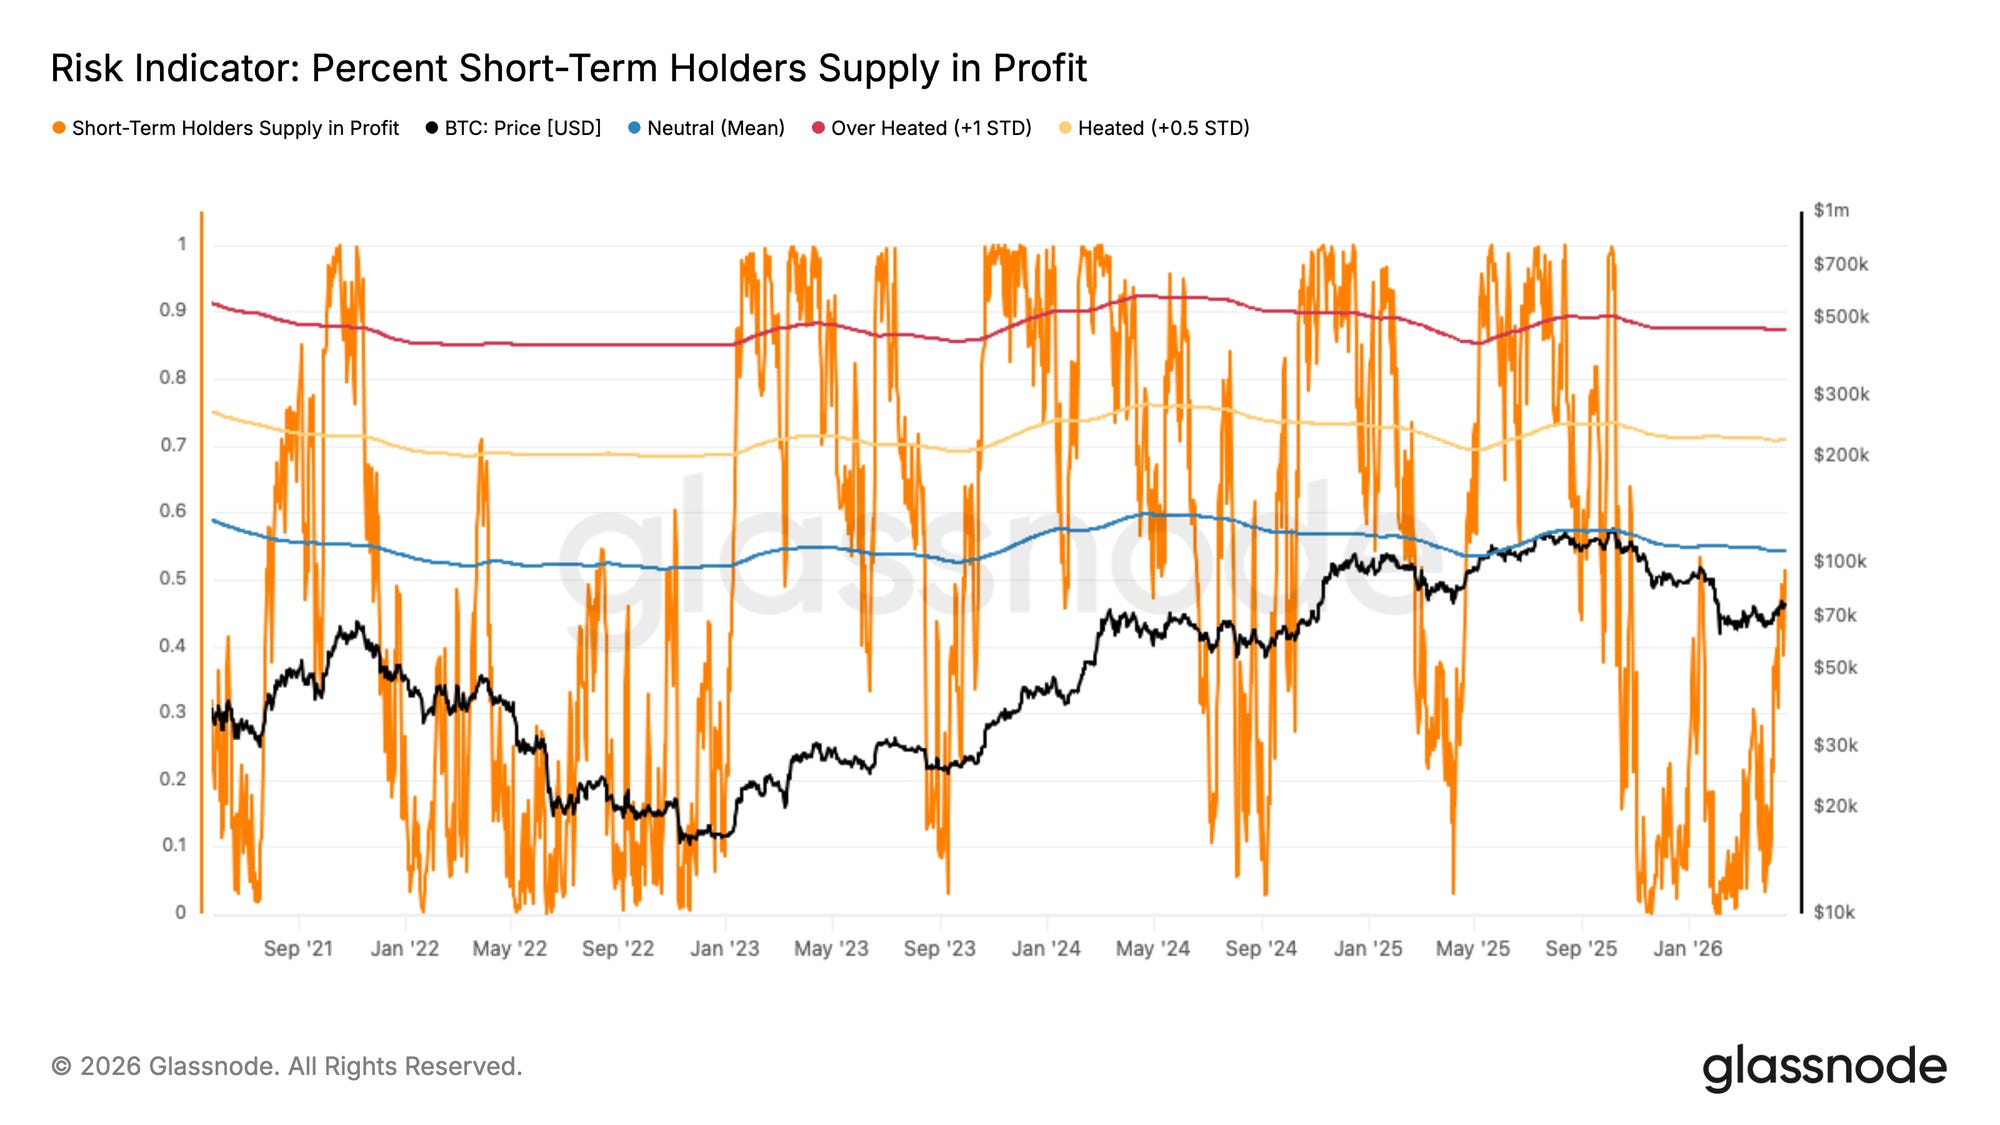
When this reading climbs above 0.5, it historically coincides with peak distribution pressure during bear market rallies. We are reaching a point where the concentration of profitable short-term holders becomes sufficient to overwhelm incoming demand. Seizing the opportunity to exit at breakeven is a powerful psychological force. This is the second time in this cycle we’ve seen this structure form, reinforcing its reliability as a local top indicator.
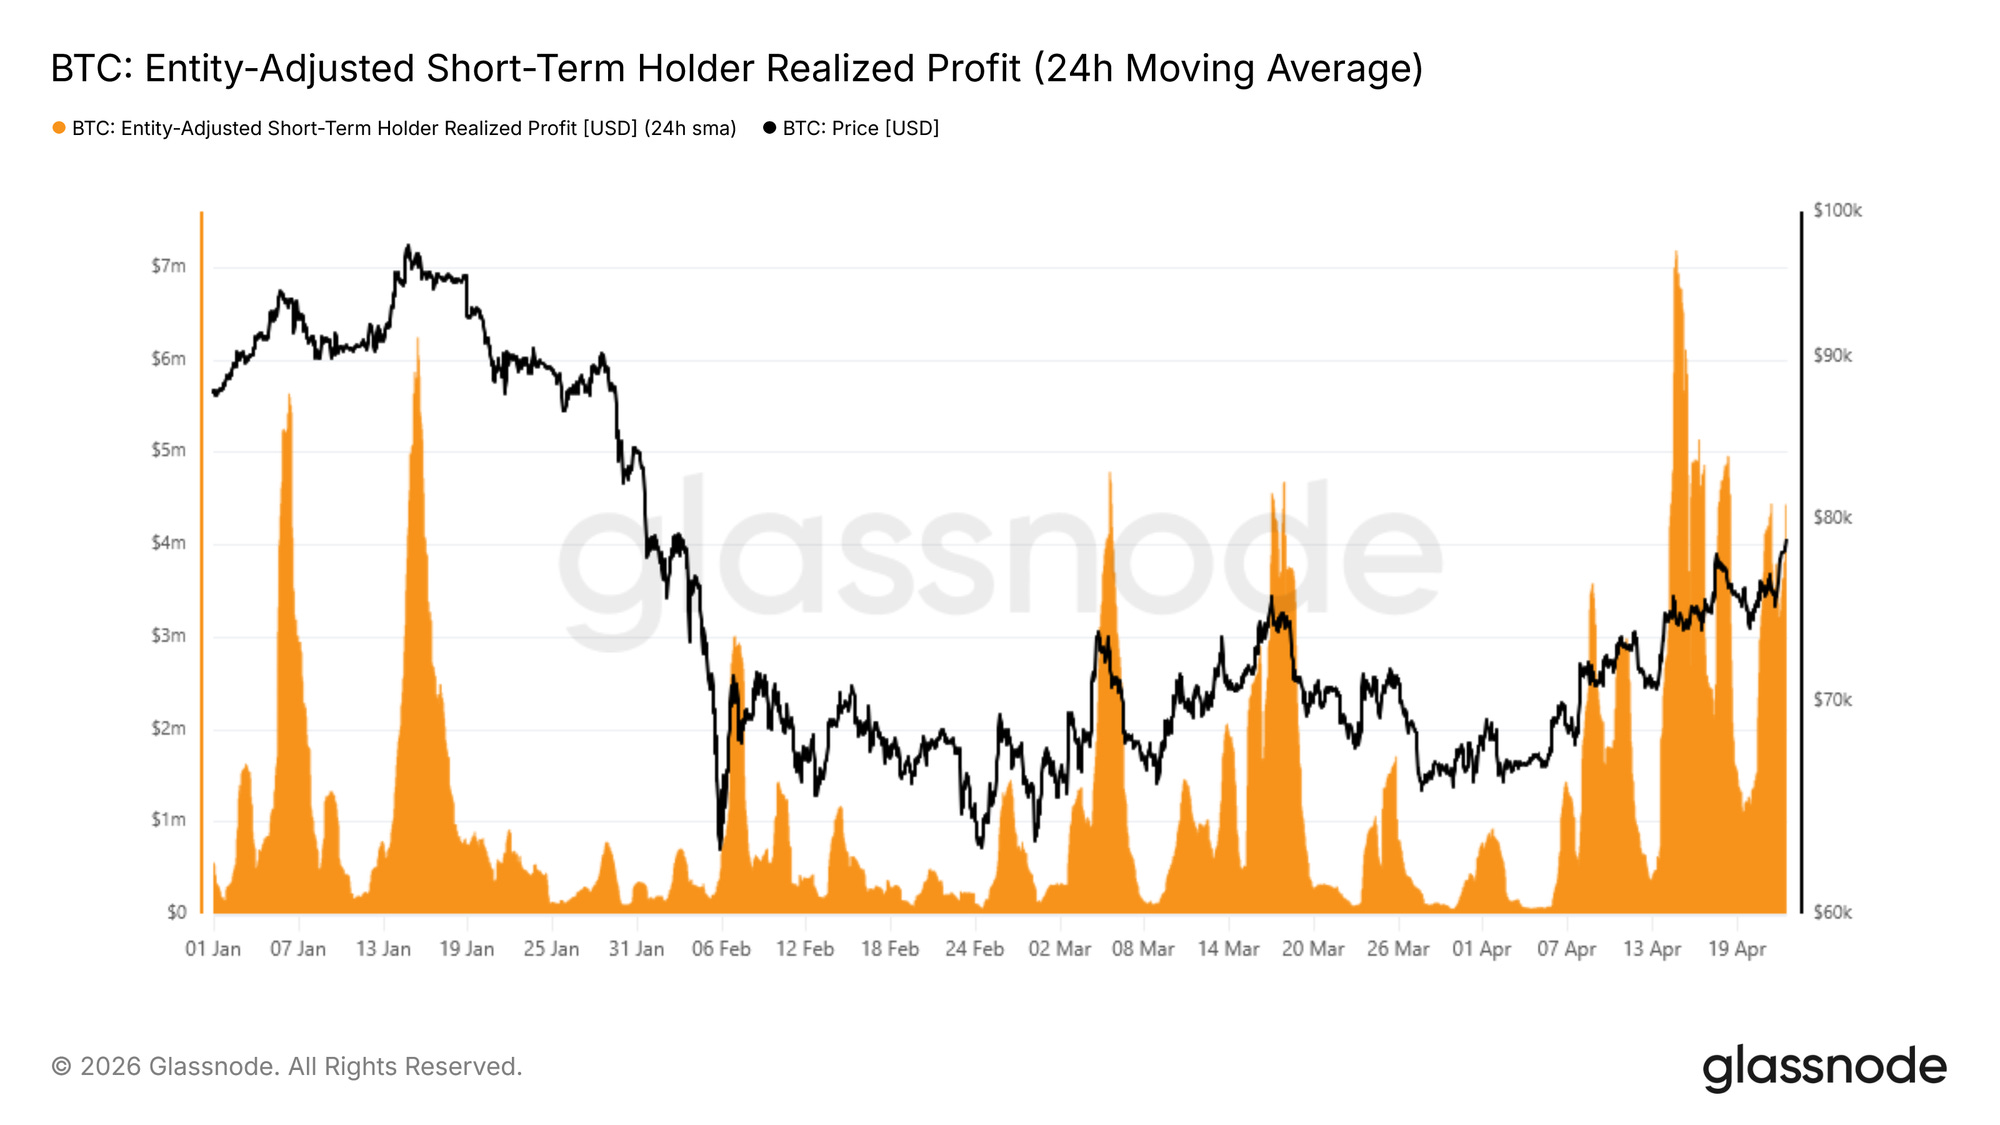
Realized Profit Spikes: The Warning Siren
The structural picture is being confirmed by real-time spending behavior. As we re-test the $80k zone, the 24-hour SMA of Short-Term Holder Realized Profit Volume has spiked above $4M.
Put that in context: every prior spike above $1.5M this year has coincided with a local top. We are currently at nearly three times that threshold. Without a massive, unexpected demand catalyst, a pullback from these levels is more than just likely.
The Anatomy of a Bottom
While the data suggests a local top for Bitcoin, the broader crypto landscape is showing the classic signs of a bear market.
DeFi Distress: A barrage of hacks and exploits
The Exit of the Tourists: Spot volumes and open interest are down; the hype is gone
Negative Funding: Shorts are paying longs, signaling deep skepticism
The NFT Echo: A tiny comeback in NFTs - often a sign of “echo” speculation before a final wash-out
Institutional Pivot: Some BTC treasury companies are starting to sell as their models fail to produce the promised returns
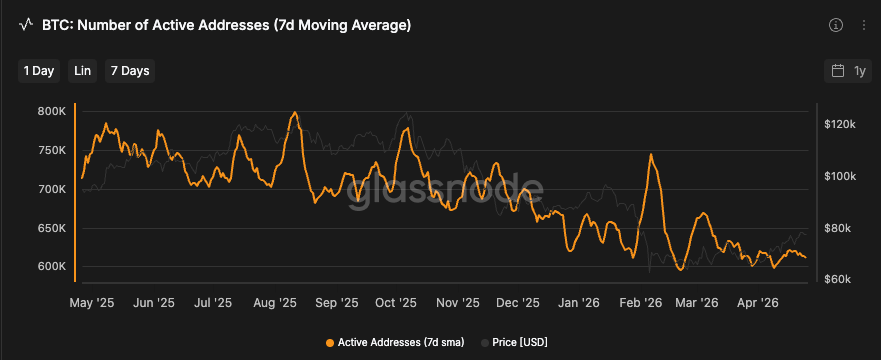
User Growth: Active Addresses are declining
This is exactly what the depths of a bear market look like. Coins are rotating hands. Sellers are becoming exhausted; especially in Alts, where many projects are down 80-90% and flatlining on zero volume.
Near Term: The Squeeze and the Whale
Bitcoin performed its second run to $80k while funding rates are at their most negative levels since April 2023. This created a short squeeze, driving the price into overbought territory on RSI.
While organic ETF flows remain weak (even though they are back positive), MicroStrategy remains the outlier, purchasing another $2.5 billion of Bitcoin this week. The key question remains: Is Saylor’s conviction enough to turn the $80k–$85k resistance into a new support floor?
Macro: The Passing of Time
At this stage of the cycle, macro is actually becoming less important. The air has already been let out of the crypto markets and moved into stocks and AI.
Moving forward, it’s less about waiting for a macro crash and more about the passing of time. I am waiting for a durable catalyst to signal the bottom. I do not see it yet.
Portfolio Management
No changes this week. I am watching the $80k level with extreme interest. Until we see Bitcoin turn this resistance into support on high volume, I remain patient with my cash. And I prefer to buy in into strength then hope.
That’s it for today - I hope I could deliver some valuable insights.
Maloha
Stay Humble. Stay Curious. Enjoy the Journey.
Disclaimer: Views expressed are the author’s personal views and should not be relied upon as investment advice.